Written by Dave Martin
  • 7/2/2018

Want to Play in the World Cup? The Math Says, Move to South America"

$name

In Part 1 of our look into World Cup results, we found that in the Group Stage of the tournament:

  • The matches end in a tie 25% of the time.
  • The lower seeded team wins 23.3% of the time.
  • There tends to be fewer upsets in the first set of matches than the other two.

Let’s dive in to examine more results by Confederation (location) with PTC Mathcad!

Soccer ball on field

I’ll start with some error checking. When I was compiling results in spreadsheets, I noticed that some countries that qualified in the past might not exist anymore, or that I might have called them something else that what my source spreadsheet calls them.

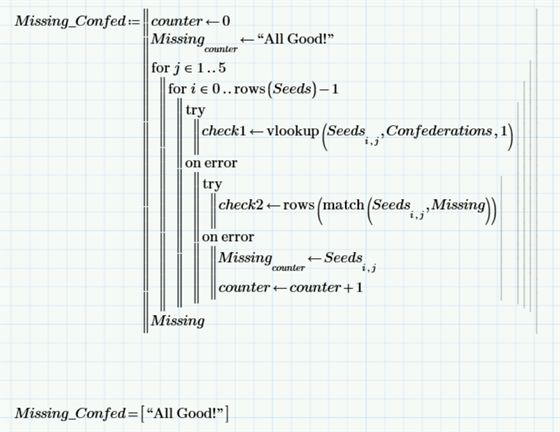
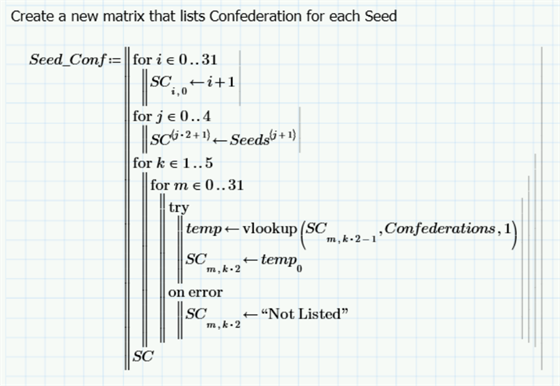
I write a program that compares my matrix of the seeds with the matrix of Confederations using a lookup and nested try – on error functions:

Program to find missing confederations

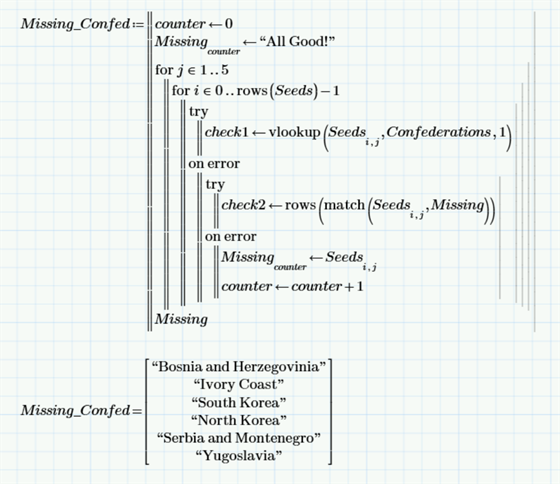
After correcting a handful of discrepancies, I’m assured that I have accounted for all countries.

Corrected program showing no missing Conferacies

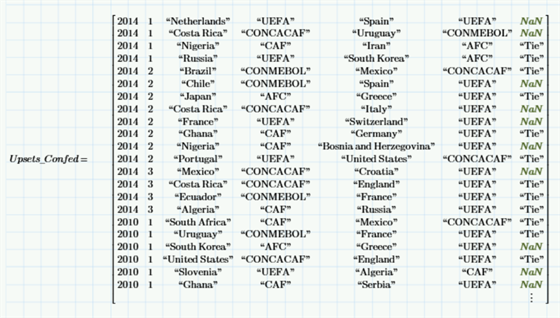
Now let’s add the Confederation data to the Upsets matrix using a lookup function. Here’s the program:

Confederation data and upset data combined

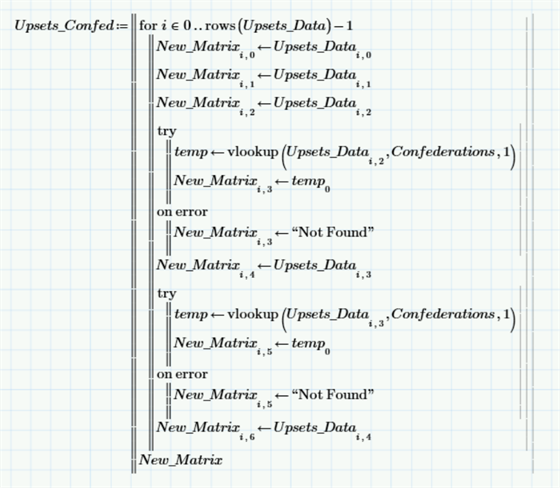
And here are the results:

Results of Confederations and upset data

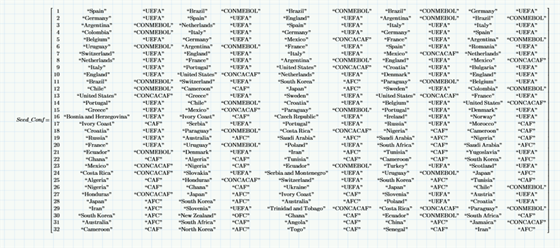
I’ll do the same with my Seeds matrix. Here’s the program:

Seeds matrix added

And the results:

 Results of seeds matrix

The first thing I want to look at is the breakdown of World Cup appearances by Confederation.

 World Cup appearance by Confederation

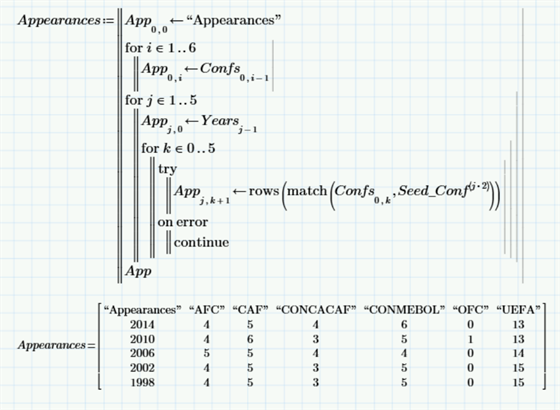
Here’s what I surmise:

  • A lot more European nations (UEFA) make it to the World Cup than any other Confederation.
  • Oceania has only made it once in the past twenty years, represented by New Zealand.

I wonder how that compares to the number of countries in each Confederation. I have a matrix that lists that:

Countries in each Confederation

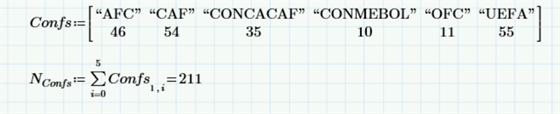
I write a program that copies the Appearances matrix and divides the number of appearances by the number of countries in that Confederation:

Appearances divided by number of countries

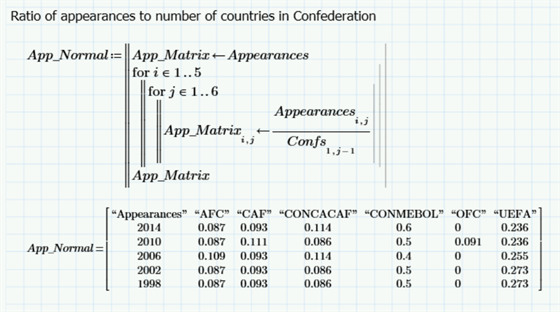
About a quarter of the teams in the European Confederation make it to World Cup. For Asia, Africa, and North America / Central America / Caribbean, it’s usually just under 10%. But wow, on average, half the teams in South America make it to World Cup.

Now let’s get to analyzing upsets by Confederation.

Upsets by Confederation

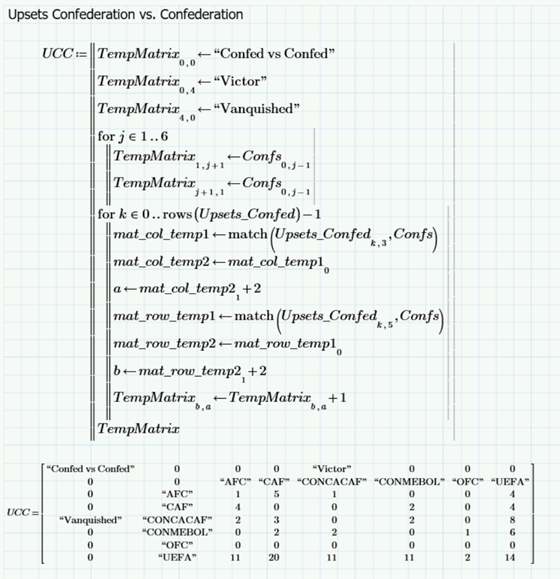
Now we’re starting to see some interesting information.

  • Remember how New Zealand was the only Oceania (OFC) team to appear in World Cup in the past twenty years? They have 3 upsets, which means they performed better than expected in every match in the Group Stage.
  • Asia (AFC) also has a distinctly better upset-to-being-upset ratio.
  • European (UEFA) teams get upset about twice as much as they outperform expectations.
  • But look at Africa (CAF)! They have a 3-to-1 ratio of upsets over getting upset.

How do these upsets fare when you look at Confederation versus Confederation? Now I’m really starting to get into some tricky programming.

 Confederation vs. Confederation

  • Along the diagonal you have upsets between teams of the same Confederation. But FIFA tries to spread teams out, so with 8 Groups, it’s easy to keep Asia, Africa, the Americas, and of course Oceania, from playing each other. But with so many European teams, there’s a high number of intra-confederation upsets.
  • If you compare the vertical column for Europe (UEFA), it looks like they upset a lot. But then when you compare it to the horizontal row, you can see that they get upset way more than they upset.
  • Again, look at Africa (CAF). They really are on the delivering end of a lot of punishment.

What will help me predict outcome of a given match is knowing the differential. A simple program will copy the matrix and calculate the differential between upsetting and being upset. Negative values within a column are bad for that confederation, and the more negative the number, the worse off it is for them.

Why Africa, Asia, and South America most likely to upset Europeans

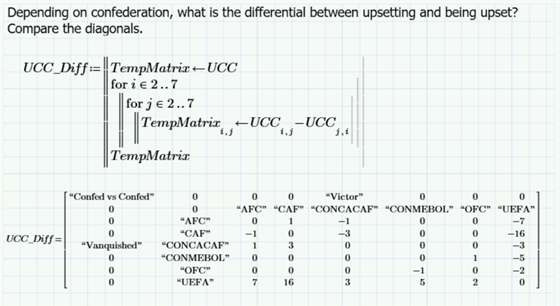
What does this tell me? I’m favoring African, Asian, and South American teams to upset European teams.

That’s all for now. For those of you who like International Football as much as I like American Football, you should have lots here to digest.

What I find interesting is that I know relatively little about FIFA and World Cup, but with PTC Mathcad, I can still mine data and uncover interesting results.

Getting More Out of Data with PTC Mathcad

Do you have data you want to crunch? Numbers you’re trying to make meaning from?  Download PTC Mathcad Express , your free-for-life copy of PTC’s engineering math software.

Download PTC Mathcad Express free

Tags:

About the Author

Dave Martin is a Creo, Windchill, and PTC Mathcad instructor and consultant. He is the author of the books “Top Down Design in Creo Parametric,” “Design Intent in Creo Parametric,” and “Configuring Creo Parametric,” all available at amazon.com. He can be reached at dmartin@creowindchill.com.

Dave currently works as the configuration manager for Elroy Air, which develops autonomous aerial vehicles for middle-mile delivery. Previous employers include Blue Origin, Amazon Prime Air, Amazon Lab126, and PTC. He holds a degree in Mechanical Engineering from MIT and is a former armor officer in the United States Army Reserves.