World Cup is upon us! Every four years, 32 of the top football teams from more than 200 countries compete for over a month in 64 matches to be crowned as the world champion. More than one billion people watched the 2014 final match between Germany and Argentina, and 3.2 billion people watched World Cup in both 2010 and 2014 – almost half the world’s population.
(Note for our American readers: in this article, football refers to what is known as soccer in the United States, as opposed to American football.)
What can we learn about World Cup from PTC Mathcad?

For the past five tournaments (since 1998), 32 teams have been selected to participate. The country that hosts the World Cup automatically receives a spot in the tournament. The other 31 teams come from 6 confederations representing:
These teams are ranked – or seeded – and then divided up into 8 groups of 4 teams, distributed by skill and geographic location. The competition starts off with group play, in which each team plays the other three teams in their group. Three points are awarded for a win, one point for a tie, and zero for a loss. The top two teams in each group advance to the single-elimination phase, consisting of:
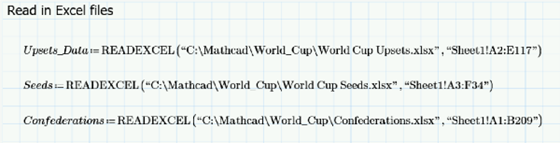
I start by reading in my initial three Excel files that contain the data for the Group Play matches:
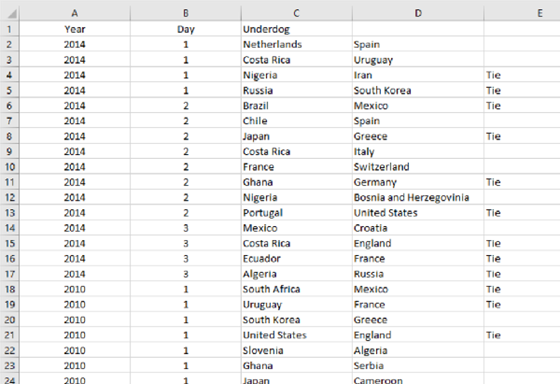
The first spreadsheet is the list of upsets, by year and match day, listing both the underdog and favored team, and indication whether the game resulted in a tie:
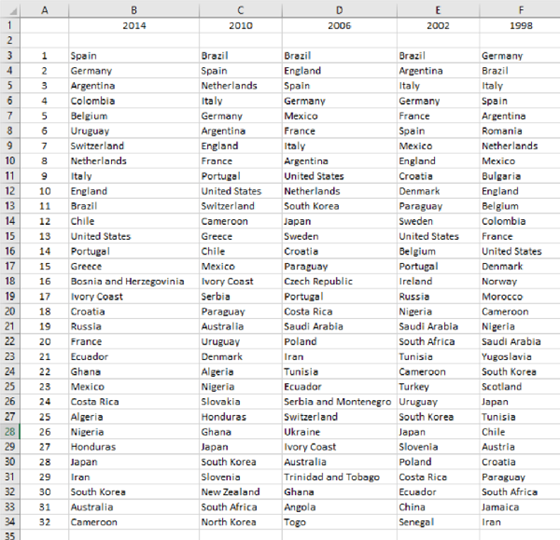
The second spreadsheet lists the seeding order for the 32 teams each year:
My final spreadsheet (for now) lists the countries by confederation, so later I can analyze the results by geographic area.
For the sake of this study, we’ll consider an upset as any match in which the higher seeded team doesn’t win. Let’s crunch the numbers:
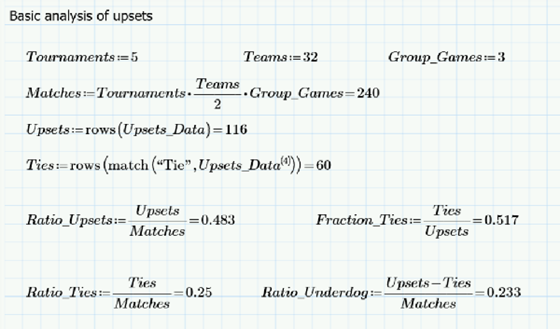
Wow. In the past 5 tournaments, one quarter of all matches ended in a tie, and the underdog won 23.3% - or almost one quarter of the time – as well. (And as we’ll see in the seed analysis later, #32 teams have beaten #1’s.) Almost half the time, the result is an upset.
Now let’s look at upsets by year. To do so, I’ll write a program that constructs a matrix to show the number of total upsets and ties by year:
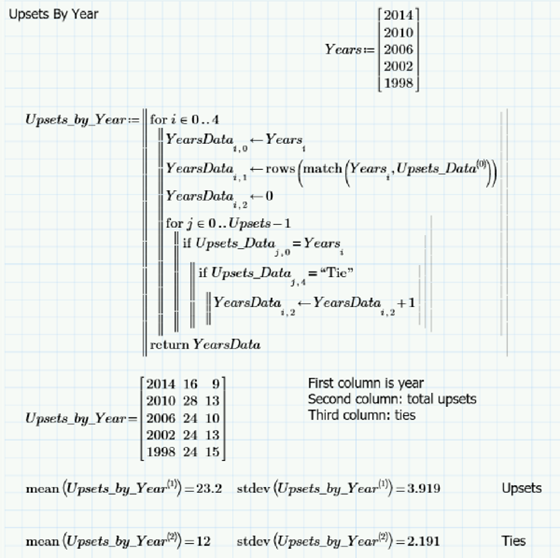
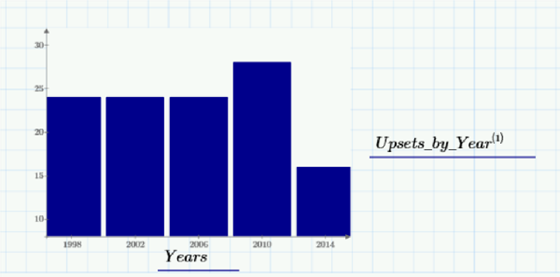
We can see that 2014 had significantly fewer upsets and ties than in previous years. It’s difficult to extrapolate with only five datasets in the era of the 32-team field, so it’ll be interesting to see what happens in 2018.
As mentioned earlier, in group play, each team plays every other team in their group once. Let’s see what the trend for upsets and ties look like on the three days. Once again, I’ll use the power of programming in PTC Mathcad to analyze my data and construct a matrix of the results that I can easily graph.
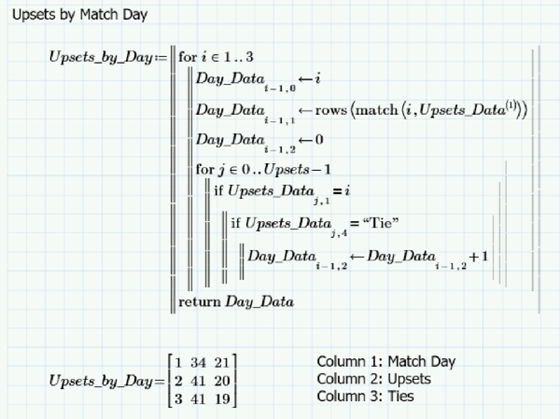
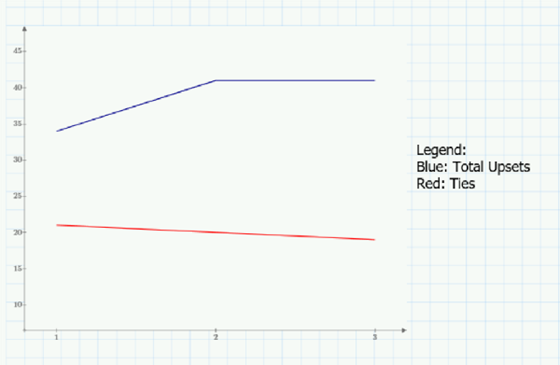
Interesting. We can see that there tend to be fewer upsets in the first match of group play, yet the overall number of ties stays consistent; lower seeded teams don’t win as much in that first match.
In American football, former NFL commissioner Bert Bell said, “On any given Sunday, any team can beat any other team.” This helps us understand the appeal of international football. It’s fast paced, relentless, a sport of skill, endurance, and teamwork. In every match, the mighty can fall and unexpected heroes can emerge. And as the math shows, there’s an even chance that the underdog will surprise you.
Stay tuned, because there’s more World Cup action to come!
Do you have data you want to crunch? Numbers you’re trying to make meaning from? Download PTC Mathcad Express, your free-for-life copy of PTC’s engineering math software.

Dave Martin is a Creo, Windchill, and PTC Mathcad instructor and consultant. He is the author of the books “Top Down Design in Creo Parametric,” “Design Intent in Creo Parametric,” and “Configuring Creo Parametric,” all available at amazon.com. He can be reached at dmartin@creowindchill.com.
Dave currently works as the configuration manager for Elroy Air, which develops autonomous aerial vehicles for middle-mile delivery. Previous employers include Blue Origin, Amazon Prime Air, Amazon Lab126, and PTC. He holds a degree in Mechanical Engineering from MIT and is a former armor officer in the United States Army Reserves.