“Painting is a science and all sciences are based on mathematics.”
Leonardo da Vinci
September’s Mathcad challenge was to use the Chart Component, XY Plot, Polar Plot, Contour Plot, or 3D Plot, create some kind of image that evokes the beauty of math. There were no other guidelines regarding simplicity or complexity. Let’s dive into the submissions!
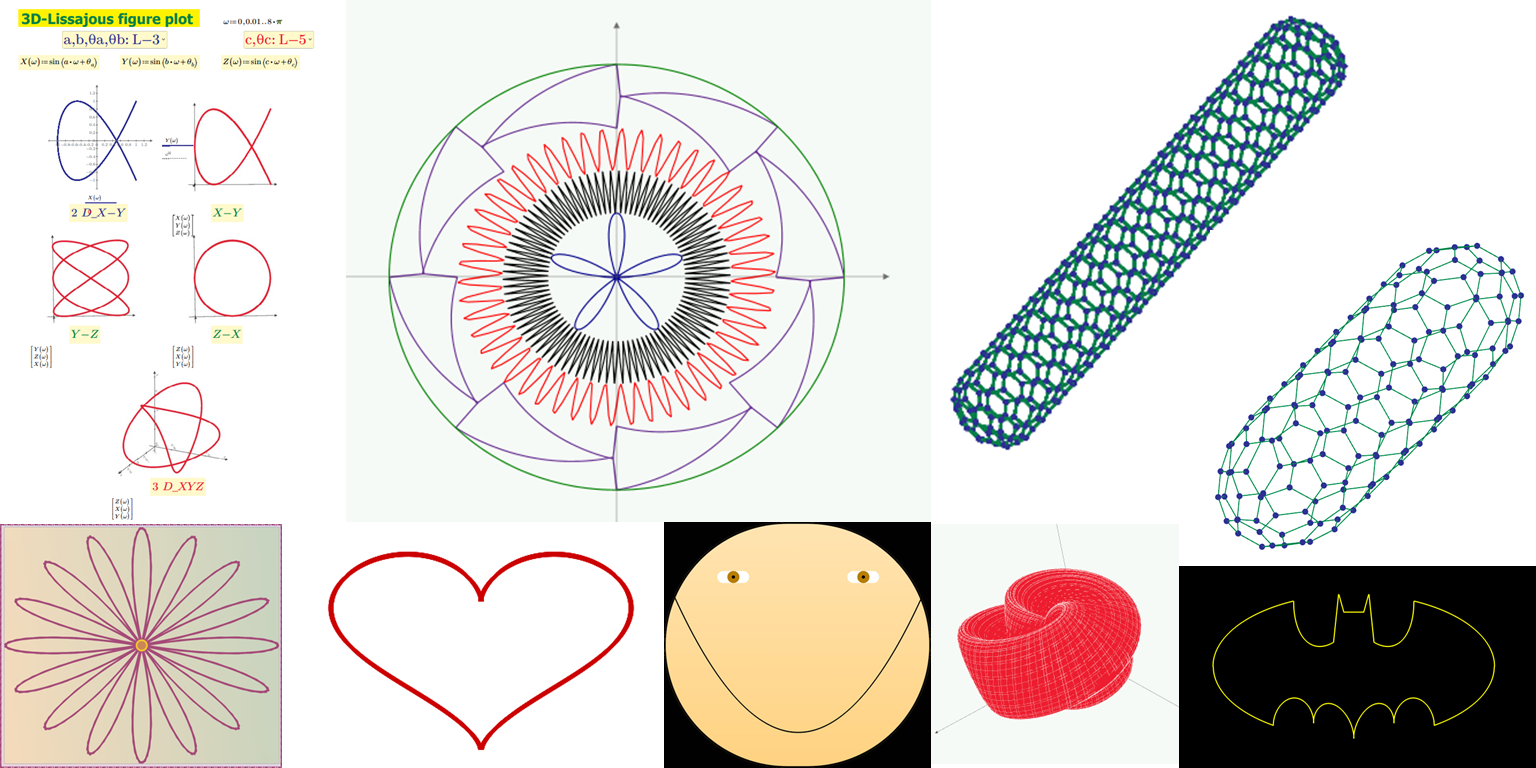
The first submission was a smiley face from the Mathcad Community Challenge organizer, David Newman. Normally, people involved in the challenge don’t submit to it. But I’m citing it because even though I consider myself highly proficient at the Chart Component, I learned a lot from this. Most of the image was created by applying a gradient fill to the background and – something I’ve never even considered – using a black chart border with huge values for the size of the corners. Ingenious. The worksheet itself uses a collapsed area to hide some range variables. There are seven traces in the Chart Component: a parabola, two ellipses, and five points. Changing the weight values for the traces helps achieve the smiley face image.
You might not think this art is particularly aesthetic; beauty is in the eye of the beholder. But you can apply these techniques to your charts.
As I remarked in the community site comments, the submission by frequent contributor Alan Stevens reminded me of the repeating patterns of a Spirograph toy from my youth. The build-up of the math is quite interesting. A range variable is created from 0 to 360 for degrees. But since Mathcad uses radians, he constructs a vector using the range variable to define radian values. Six different variables (vectors) created using the sine function, modulus function, and a constant value. These variables are stacked, and then graphed on an X-Y plot using the vectorize operator. A lot of good stuff here.
A subsequent image appears to have eliminated the stacking so that different colors can be applied to each of the variables. As noted in the discussion on the community site, the NaN (Not a Number) value can be used to avoid lines being drawn from the end of one value in the stack to the first value in the next variable in the stack.
(Side note: the image was also helped by turning off the grid display on the worksheet.)

Frequent contributor TTokoro submitted two worksheets. The first displays a 3D version of the Lissajous curve, which is also known as the Bowditch curve. You have seen this curve on oscilloscopes, television images, and old science fiction movies because of the beauty of its harmonic motion. The first worksheet makes nice use of the Combo Box input-output control to change the values of the coefficients and phase angles. A Lissajous curve is normally 2D, but TTokoro made it 3D by also defining a parametric equation for z-value, controlled by its own Combo Box. I recommend downloading the worksheet and both playing around with the different choices as well as seeing how the Combo Box was constructed.
There are four X-Y plots and one 3D plot. The X-Y plots depict the traditional 2D Lissajous and the projections of the 3D Lissajous onto the XY, YZ, and ZX planes. The 3D plot shows the 3D version of the Lissajous.
TTokoro’s second worksheet has a couple long, complex programs that I won’t even pretend to understand. They are used to create some cool 3D plots that I recommend you play with. They consist of repeating 5- and 6-sided 3D polygons in structures of connected nodes that remind me of finite element meshes and additive manufacturing beam structures. They would also be at home in a Marvel movie. Check them out and spin them around because the image changes depending on the angle.
The final submissions came from PTC’s own Tetiana "Tanya" Pakhomova. She is not even a Mathcad user and she was able to graph a simple and sweet 2D heart in the Chart Component. My only advice would be to turn off the plot border, axes, and tick marks and turn on a user-defined range for the Y-axis. Nice use of color and thickness for the trace.
The challenge then inspired Tetiana to learn more about Mathcad. She said that initially she was apprehensive about the Chart Component but quickly found it easy to grasp. She then submitted a dark pink cosmos flower, reminiscent of her childhood home in Ukraine, by using the parametric form of the rose curve for the petals. The pistil was formed via a point in the middle with weight and opacity. The frame to the picture was made by using gradient colors for the chart background and plot area, and a thick centerline dash line style. Very creative use of the formatting tools in the Chart Component.
Even with a handful of submissions, users created art with the Chart Component, X-Y Plots, and 3D Plots. They used functions, range variables, vectors, programs, the vectorize operator, and Combo Boxes. There’s a breadth of tools and techniques available to create art and communicate your results to an audience.
This challenge reminds us that math is fun and it’s beautiful. Download the submissions and then make art in Mathcad for yourself. If you want even more ideas for generating 2D/3D curves and 3D surfaces in Mathcad, I recommend checking out Alfred Gray’s book, Modern Differential Geometry of Curves and Surfaces. And stay tuned for the next Mathcad Community Challenge in November.
Make sure you hear about new Mathcad challenges as they happen by subscribing to our monthly newsletter.