
During the NFL playoffs this year, I noticed top seeded teams dominated in the road to the championship game. Therefore, I decided to use PTC Mathcad to analyze how much of an effect seed has on the outcome.
Seeding is the ranking of teams after the regular season based on their overall record. In the event of a tie, other factors are considered like head-to-head record, division record, strength of victory, points, touchdowns, and eventually, a coin toss.
Seeding provides two major advantages to teams: a potential bye week during the first round and home field advantage. A team with a bye needs to win only two games to make it to the championship. More importantly, they have an extra week after the regular season to recover from injuries and prepare for the next opponent.
The NFL started seeding teams in the 1975 season, with 8 teams going to the playoffs. This expanded to 10 teams in 1978, with the top 3 teams in each conference getting a bye week. With the exception of a strike year, this format continued until 1990. The playoffs expanded to 12 teams, with the top two teams in each conference receiving a first week bye.
(Starting with this year’s 2020 playoffs, the field expands to 14 teams, with only the top team in each conference getting a bye. This makes the final week in the season much more competitive. Teams had taken to resting their star players in the final week.)
Home field advantage provides benefits like playing in your own stadium and sleeping in your own bed instead of a hotel room. As I’m writing this, the Florida-based Buccaneers travel to cold Wisconsin for the NFC Championship. Home field matters.
I started by using Mathcad’s READEXCEL function to import my spreadsheet of NFL seasons and seeds. I used functions to count the number of games as well as create submatrices of the games since 1975 (the seeding era) and 1990 (the modern era).
To analyze the data, I used Mathcad’s programming functionality to create matrices to:
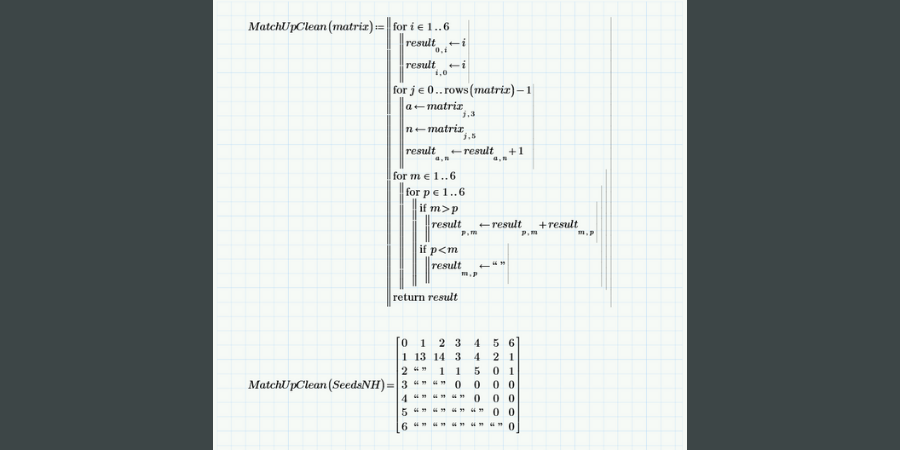
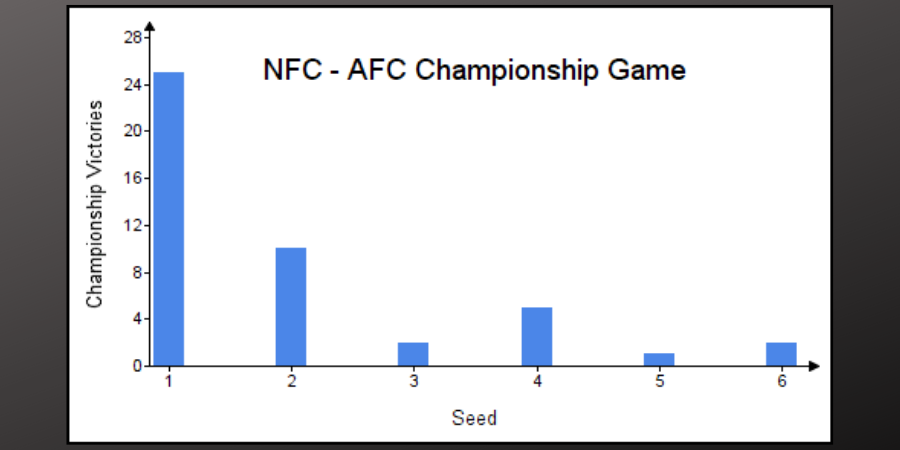
Top seeding definitely has an advantage.
I used Mathcad’s Chart Component functionality to graph a histogram of winners by seed:
With the new format, the #1 seeds will be even more favored to win the championship. While I appreciate the NFL reducing the number of garbage games in week 17, I fear the playoffs will become less relevant. Often the difference between a #1 and a #2 seed or a #2 and a #3 seed is a single game during the regular season.
To make the playoffs more competitive and entertaining, eliminate the bye week.
Perform, analyze, document, and share your calculations starting now