Editor's note: This blog article was originally written as a PTC Mathcad Prime worksheet. For the best reading experience, please download the Mathcad Prime 8 worksheet here. If you need a Mathcad Prime worksheet viewer, download Mathcad Prime for free here.
A truck driving on a bridge causes the supporting beams to deflect, resulting in various stresses in the beams. Similarly, as you walk across the floors in your home, the beams or joists deflect under your weight. The deflection is a result of the loading, which is related to the shear, the bending moment, the beam slope, and the beam deflection. In this blog and several that follow, I will discuss how Mathcad can be used to calculate, plot, and derive these relationships.
Drawing shear and bending moment diagrams of simply supported beams is one of the tasks in a basic engineering statics course. Mathcad can be used to calculate shears and moments and also draw the shear and bending moment diagrams.
In this blog, I will show how to do this for simply supported beams with varying loading conditions.
I am a proponent of creating functions so that they can be used multiple times, rather than just solving a single problem. So, first, let's create some functions to help solve for and plot the shear and bending moment diagrams for a uniformly loaded, simply supported beam.
The figures in this blog were created in Microsoft PowerPoint as embedded objects. If you download the linked Mathcad file and double click on the figure it will open in PowerPoint.

Let's first calculate the left reaction, RA, by summing the moment about point B, and then calculate the right reaction, RB, by summing the vertical loads.
Once these functions are written, the results will be tested. A clockwise moment will be considered positive.
The variable "Span" is the length of the beam, and the variable "w" is a uniform load (force/length) along the length of the beam. Because Mathcad is unit aware, the span and load can be in any units of length and force.
The right arrow in the below functions is the Symbolic Evaluation Operator from the Symbolics section on the Math tab. It provides a symbolic solution rather than a numeric solution.

Next, write a function for shear at a distance x by summing the vertical loads. The shear at a distance x from the left is equal to the left reaction less the load applied to the beam between the left and the distance x (w*x).

Now, write a function for the moment at a distance x by summing the moments about x.

Now that the equations are written, calculate and plot the shear and moment diagrams using the XY plot features. Insert the plot from the Plots menu in the Traces section. Select XY Plot from the Insert Plot button.
In order to create the plots, define the values for span and load, and then create a range variable for the points to plot. The range variable is defined by a starting value with the second value setting the step size. The final number is the ending value. It is created just like it looks. Type the first value, then type a comma and enter the second value, which sets the step size. Then, type . . and enter the ending value.
The equation for shear or moment will be on the y-axis.


Test again using metric units. Define values of span and uniform load, and the range variable, z, which will set the points to plot.


Let's now create shear and moment diagrams for a point load, P, placed anywhere along the beam at a distance "a" from the left end. Create functions to describe the loading, shear, and moment. Ignore the beam weight for this exercise. For this example, I use the keyword solve with the Symbolic Evaluation Operator to demonstrate how to solve for RA.


Now that the equations for a point load are written, calculate and plot the shear and moment diagrams using the XY plot features.
In order to create the plots, define the values for span, load, and distance, and then create a range variable for the points to plot.


This final example derives the functions for a triangular loading.
Similar to the previous examples, create functions for the reactions, and then create functions for shear and moment.
This example uses the solve keyword with the Symbolic Evaluation Operator to derive the functions for reactions.


Define values for span, loading, and the range variable, z, which will set the points to plot. Display the values of the range variable and the calculated shears and moments that will be included in the plot.


Now that functions for uniform load, point load, and triangular load have been derived, use these functions to combine multiple loading conditions.
For these examples of combining loads, numeric results will be used and values of the loading conditions must be provided. Range variables will be used to define the points to plot and locations to calculate shears and moments. It is important to evaluate the range variable (using the = sign) to convert the range variable to a vector of values.
Note the use of the Vectorization operator in these examples. It is found on the Matrices/Tables tab in the Matrices and Tables section, in the Vector/Matrix Operators button. The Vectorization operator is the bottom operator. (It is also found in the Operators section of the Math tab in the Vectors and Matrix area. The keyboard short cut is CTRL + SHIFT + ^.) It is a right pointing arrow above the expression. It tells Mathcad to perform the operation on an element-by-element basis.
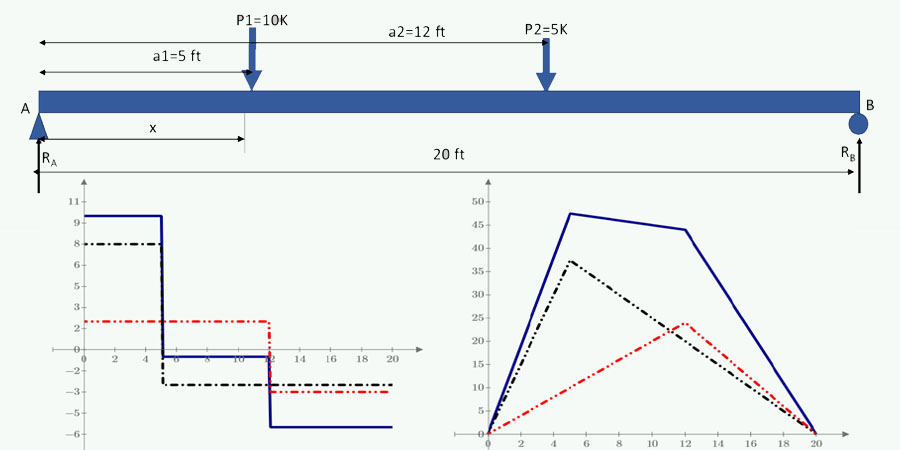
The following examples show a combination of point loads, uniform loads, and triangular loads.


 loaded beam")


 loaded beam")
In this blog, I have used shear and bending moment diagrams to illustrate many Mathcad features. In addition, I have shown how to combine functions for uniform load, triangular load, and point loads to calculate and plot reactions, shears, and bending moments. These examples illustrate:
Download a free 30-day trial of Mathcad Prime to see the best of Mathcad for yourself.